Five strategies for dealing with market volatility
Uncertain markets can be challenging, but a solid strategy can help. Learn five practical steps to manage volatility and stay on track with your investment goals.

Periods of volatility in global share markets and negative returns can understandably create uncertainty for many investors. We discuss five steps investors can take to help navigate market ups and downs.
1. Understand volatility is a normal part of investing
While market downturns can be unsettling, it is important to remember that volatility is a natural part of investing. Share markets are constantly on the move, both up and down.
Fluctuations in share markets are usually driven by a combination of factors such as geopolitical events, movements in interest rates, changes in the economic outlook and shifting investor sentiment.
History shows us that these market downturns are typically cyclical. Over the long term, shares generally rise in value, though they experience both ups and downs along the way. Market downturns are usually followed by a recovery, though each cycle is unique, making it difficult to predict when a cycle’s peak or trough will occur, or how long it will last.
There is a well-known investing adage: “It’s time in the market, not timing, that matters.” By staying invested through different market cycles, you give your portfolio the time to recover from downturns and benefit from the long-term growth that time - rather than timing - can deliver.
2. Take a long-term view
Share markets are constantly on the move, both up and down. History shows us that over the longer term, markets usually recover from short-term declines.
Although shares are volatile and occasionally deliver negative returns, they have historically offered the highest potential for long-term growth. By staying invested, you position yourself to benefit from the compounding returns that shares can deliver over time.
Keeping a focus on the long-term can be helpful when navigating market cycles. Returns tend to be less volatile over longer time periods, as illustrated in chart 1.
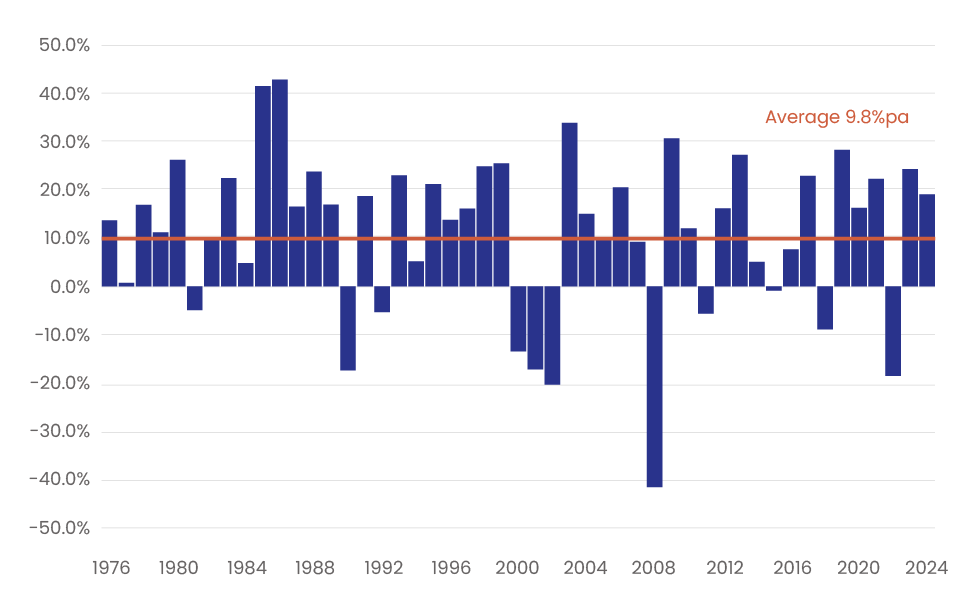
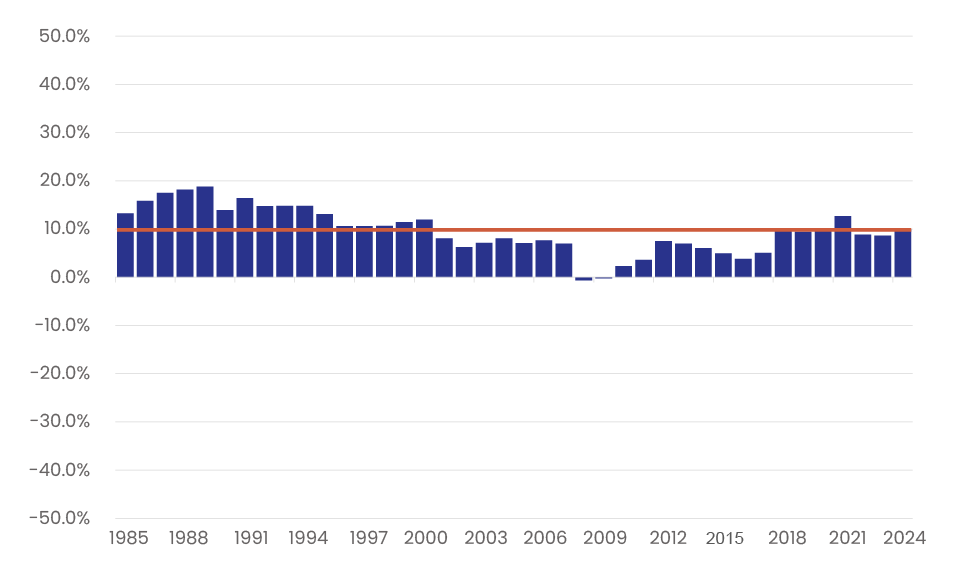
Chart 1. Time’s smoothing effect on returns
Returns from global shares 1975-2024 (US dollars, calendar year returns)
12 month returns | Rolling 10 years returns (%pa) |
|---|---|
|
|
Source: Bloomberg. Global shares represented by the MSCI World Net Total Return Index (US dollars). Calculations by Smart.
The average return from global shares (in US dollars) since 1975 has been 9.8% per annum. Returns over 12-month periods (we have used calendar years) have ranged from 42% in 1986 to -41% in 2008. In contrast, returns are significantly less volatile using a 10-year holding period. The highest return is 19% per annum for the 10 years ended 1989 and the lowest is -0.6% per annum for the 10 years ended 2008.
Having a long-term investment timeframe and staying invested through market cycles helps smooth short-term ups and downs in your investments.
3. Have a diversified portfolio
Market uncertainty is a constant – it is impossible to predict exactly when markets will rise or fall, or which markets or assets will perform best. This is why appropriate diversification is a cornerstone of long-term investing.
Diversification means spreading your portfolio across a wide variety of investments. Different assets and markets can respond differently to market fluctuations, meaning that holding a mix of investments - such as local and global shares, listed property, fixed interest and cash - can reduce your portfolio’s volatility, cushion the impact of downturns and help you get more stable returns.
Chart 2 illustrates how diversification can help reduce volatility. It compares the performance of global shares, global bonds, and a diversified portfolio with a 60% allocation to global shares and 40% to global bonds, from 1990 to 2024.
A well-diversified portfolio will typically hold more than just two investments; however, for simplicity, our example focuses on just these two.
The portfolio combining global shares and bonds was less volatile during market downturns. For example, during the dot-com downturn from 2000 to 2002 and the global financial crisis of 2008, the mixed portfolio of global shares and bonds was more resilient than global shares alone.
This chart also illustrates how markets have bounced back from setbacks. Global shares recovered from both the dot-com downturn and the global financial crisis and have gone on to deliver an annual return of 8.2% over this period, while the 60/40 mix provided an annual return of 7.0% and global bonds 4.3%.
Chart 2. Diversification’s smoothing effect on volatility
Growth in US$100 and annual return 1990-2024 (US dollars, calendar year returns)

Source: Bloomberg. Calendar year returns. World shares represented by the MSCI World Net Total Return Index (US dollars). Global bonds represented by the Bloomberg Global Aggregate Bond Index (US dollars). The 60/40 blend is rebalanced annually. Analysis by Smart. Past performance is not a reliable indicator of future performance.
We can illustrate the difference in risk using standard deviation, a statistical measure that shows how much an investment’s returns vary from its average return over time. For example, a standard deviation of 10% means returns can typically fluctuate by plus or minus 10% from the average return each year, 68% of the time (which is one standard deviation). A higher standard deviation indicates higher risk.
Based on the returns from 1990 to 2024 shown in chart 2, global shares had a standard deviation of 17.1%, while the 60/40 mix of global shares and bonds had a standard deviation of 11.3%.
This means that by diversifying a portfolio by combining these two assets, risk was reduced by 34% (from 17.1% to 11.3%) but the return was only 15% lower; global shares returned 8.2% but the mixed portfolio still returned 7.0%. See table 1.
Having a diversified portfolio can reduce risk because different investments don’t always move in the same direction or by the same amount. For instance, there can be times when global bonds may rise in value when global shares fall. This interaction across different investments is what helps insulate a diversified portfolio from market volatility.
A benefit of this lower level of volatility is that a diversified portfolio provides more stable returns compared to holding only global shares, as shown by the range of 1-year and 10-year returns in table 1.
Table 1. A closer look at risk and return
1990-2024 (calendar year returns, US dollars)
Global Bonds | Global Shares | 60/40 Mix of Global Shares and Global Bonds | |
|---|---|---|---|
Growth in US$100 | $416 | $1,455 | $1,000 |
Annual return | 4.3% | 8.2% | 7.0% |
Risk – volatility of returns | 7.2% | 17.1% | 11.3% |
Range of 1-year returns | -16% to 20% | -41% to 33% | -23% to 25% |
Range of rolling 10-year returns | 0% to 8% | -1% to 13% | 2% to 10% |
Source: Bloomberg. Calendar year returns. World shares represented by the MSCI World Net Total Return Index (US dollars). Global bonds represented by the Bloomberg Global Aggregate Bond Index (US dollars). The 60/40 blend is rebalanced annually. Analysis by Smart. Past performance is not a reliable indicator of future performance.
To better show the relationship between the risk and return figures in table 1, they are displayed in charts 3 and 4 below.
Chart 3. Risk and return
1990-2024 (calendar year returns, US dollars)

Source: Bloomberg. Calendar year returns. World shares represented by the MSCI World Net Total Return Index (US dollars). Global bonds represented by the Bloomberg Global Aggregate Bond Index (US dollars). The 60/40 blend is rebalanced annually. Analysis by Smart. Past performance is not a reliable indicator of future performance.
Chart 4. Range of returns
1990-2024 (calendar year returns, US dollars)

Source: Bloomberg. Calendar year returns. World shares represented by the MSCI World Net Total Return Index (US dollars). Global bonds represented by the Bloomberg Global Aggregate Bond Index (US dollars). The 60/40 blend is rebalanced annually. Analysis by Smart. Past performance is not a reliable indicator of future performance.
4. Invest regularly
Continuing your regular savings plan during periods of market volatility can be beneficial. If you are making regular contributions to your portfolio or KiwiSaver account, a fall in markets means you can invest at lower prices. Picking the best time to invest is a lot easier said than done. For most investors it is therefore better to invest regularly.
This is called a “dollar cost averaging” approach. By investing on a regular basis, regardless of the price, you average out market fluctuations over time. This also lets you focus on the average return over the long-term and not react to short-term events.
Read more about dollar cost averaging here.
5. Ensure your portfolio matches your goals, risk profile, and timeframe
While a decline in the value of your investments can understandably be concerning, making decisions based on short-term market fluctuations can have a negative impact on your long-term returns. For instance, selling during a market dip may lock in losses and prevent you from benefiting from any potential rebound as markets recover.
It is important to consider when you will need to draw on your investments.
If you have a shorter investment timeframe – meaning you may need to access your money sooner – you might want to consider a higher allocation to lower-risk investments, such as cash and fixed interest (bonds), which are less exposed to market fluctuations.
This is why it may be appropriate for investors near, or in, retirement, and others with a short-term investing timeframe, to have a mix of cash to cover immediate expenditure, fixed interest for medium term expenditure and shares for longer term expenditure.
On the other hand, if you’re investing for the long term, you’re better positioned to ride out market ups and downs. Shares have historically delivered higher returns over time, but they can experience short-term fluctuations. By staying invested through different market cycles, you give your portfolio the opportunity to recover from downturns and benefit from long-term growth.
Periodically reviewing your portfolio is a good way of ensuring it remains well-diversified and has a mix of assets which aligns with your goals, investment time frame and risk profile. These factors – rather than short-term market fluctuations – should guide your investment decisions.
This information is issued by Smartshares Limited (Smart), a wholly owned subsidiary of NZX Limited. Smart is the issuer and manager of the Smart Exchange Traded Funds. The product disclosure statements are available at smartinvest.co.nz.
Past performance is not a reliable guide to future performance. The calculations and returns used in this article are illustrative and intended as a guide only, and are not an indicator of future returns. The value of investments can go down as well as up and investors may not get back the full amount invested nor any particular rate of return referred to in this article. Returns are not guaranteed.
This information is intended to provide a general guide and is based upon, and derived from sources Smart considers reliable. Neither Smart nor NZX Limited, or their respective directors and employees accept any liability for any errors, omissions, negligent misstatements, or for the results of any actions taken, or not taken in reliance on this information.
This information is not a substitute for professional advice. In preparing this information Smart did not take into account the investment objectives, financial situation or particular needs of any particular person. Accordingly, before making any investment decision, Smart recommends seeking professional assistance from a licensed Financial Advice Provider.
More from Smart:
Related articles
 A closer look at the Smart US Technology (NZD Hedged) ETFThe Smart US Technology (NZD Hedged) ETF provides targeted exposure to some of the world's most influential and innovative companies.
 Emerging Markets: A strong opportunity for 2026 Smart Chief Investment Officer, Stuart Millar shares his view on emerging markets and why they are on our radar for 2026.
  Why global markets are looking beyond the oil shockGlobal share markets have held firm despite rising oil prices and Middle East tensions. Marek Krzeczkowski, Head of Investment Strategy & Quant, explo...